Member-only story
15 More Very Scientific Charts and Graphs About the Podcast Industry
With very scientific drawings of course.
About a year ago I published a collection of “scientific” charts about podcasting. I think it’s time for round 2.
If you would like more throughout the year, follow me on Instagram.
1. The amount of time different types of media have been around. The new kid on the block is just getting started.

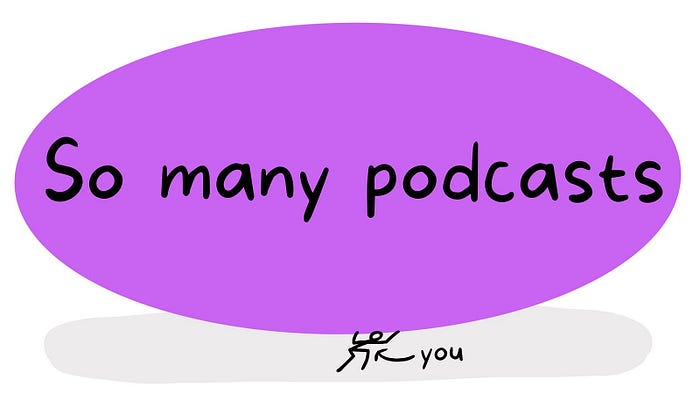
2. Send this to the next person who says there are too many podcasts (and yes it’s accurate).

3. Every millennial and Gen Z knows this truth.

4. The podcast “special play” never gets old.

5. YOU GOT THIS!
6. My favorite way to never run out of podcasts is to subscribe to all of the recommendation newsletters.

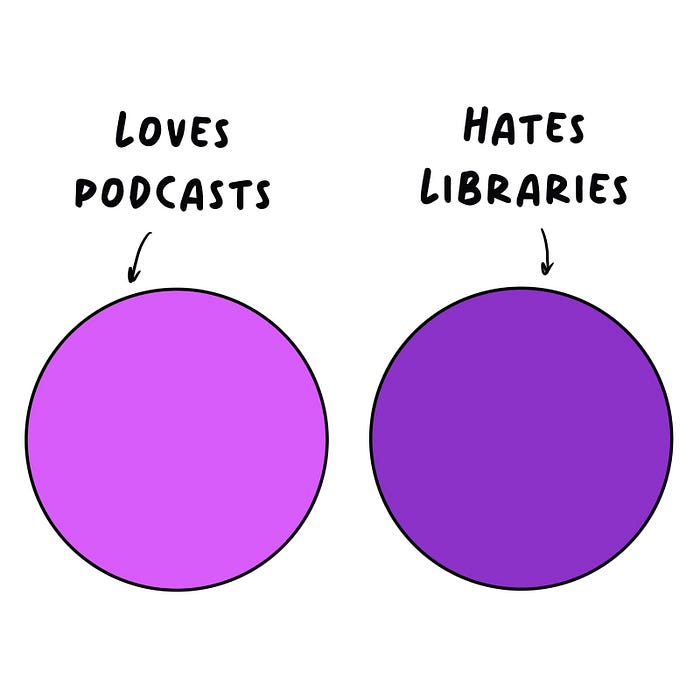
7. These two categories DO NOT INTERSECT. If this were instead labeled LOVES PODCASTS and LOVES LIBRARIES, they would be the same circle.
8. The BIGGEST dillema for podcast listeners. You can listen to like 16 podcasts in the time it takes to listen to one audiobook.